Article

Last week, the Archbishop of Canterbury, Justin Welby, wrote an exclusive for the Financial Times arguing that the UK economic model was ‘broken’.
The Archbishop’s analysis was built on the evidence and arguments of the Interim Report of the IPPR Commission on Economic Justice of which he’s a member, along with prominent business leaders, academics and representatives of civil society.
At the core of the Commission’s claim is a simple proposition: headline economic figures, which point towards a general (albeit modest) recovery since 2010, do not reflect the lived experience of the majority of people in society.
One single finding from new IPPR analysis demonstrates this perhaps better than any other. For the first time in historically comparable records, rising GDP no longer guarantees better pay in the economy. Growth in average earnings has decoupled from general economic growth for the first time, and in unprecedented fashion.
Five decades of trending real GDP per employee and real earnings
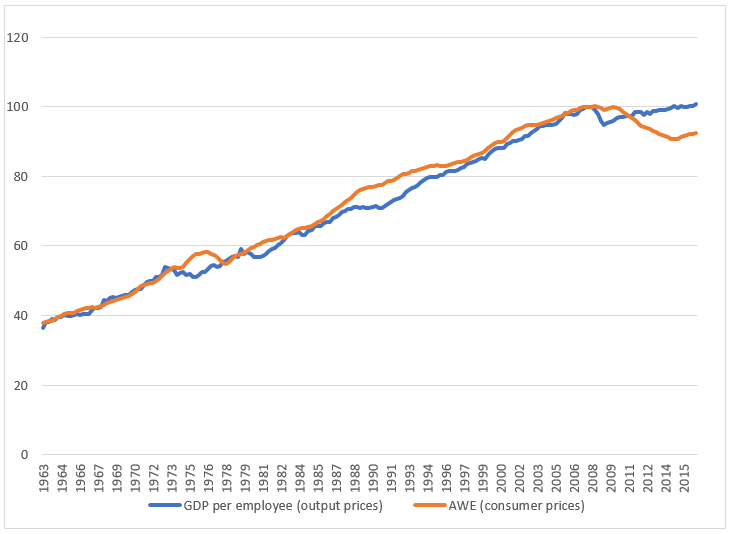
Source: Authors calculations based on ONS estimates for real GDP, average weekly earnings (2000 onwards), employment (1971 onwards) and retail price inflation (RPI); ONS experimental data for historically consistent average weekly earnings (all months prior to 2000); and Bank of England historical estimates for annual employment levels (prior to 1971). Note: We use RPI to deflate average weekly earnings as the CPI index from the ONS does not go back before 1989
Between 1963 and 2010 the association between GDP per employee and real earnings was characterised by two types of relationship.
First, outside of recessions – such as during the 1960s, the late 1980s and from the mid-1990s to the financial crash – growth in GDP and wages almost perfectly followed one another, as the benefits from production and profits were passed on to pay packets at a reliable rate.
Second, during recessions, earnings trended temporarily above GDP, as firms tended to reduce costs and output by laying off staff rather than reducing the pay packets of those that remained in work. This was true for each major recession from the 1970s onwards, including between 2008 and 2010.
But what has happened since then is striking. Between 2010 and 2016, official GDP per employee has risen by 3.5 per cent, yet real wages are 1.1 per cent lower when adjusted for consumer price inflation (CPI). If inflation is calculated to include housing costs (using the RPI measure), real wages are down 7.2 per cent.
The link between growth and earnings has broken. But why has this happened?
The UK’s collapse in productivity growth – growth in economic output per hour worked – has contributed both to low growth and stagnant wages. Over the last decade serious structural weaknesses in the economy have seen productivity deviate significantly from its historical trend.
Actual productivity and the pre-2007 trend
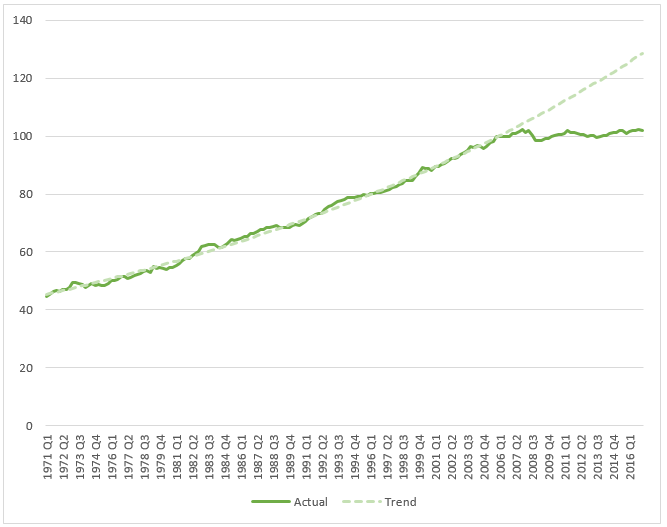
Source: Authors calculations based on ONS estimates for output per hour
One of the key causes lies in the labour market. With more than 2.5 million people unemployed between 2010 and 2013 and ready to accept low wages to get back into work, record low interest rates were not enough to make investment in machinery, software and training cheaper than simply taking on more low paid workers. In the first three months of 2017, hourly productivity (the value of an average hour’s work) was 21 per cent lower than would have been expected prior to the 2008 crisis.
But the UK’s productivity disaster, though important and often referred to, is not the whole story. Non-existent productivity growth helps explain why GDP has been sluggish, and perhaps real wages more so. But it doesn’t explain why wages have fallen.
As was recently pointed out by economist Simon Wren-Lewis, the decoupling of GDP and earnings since 2010 has been driven by a startling mismatch between the ‘official’ and ‘lived’ economy.
The official measure of real GDP uses an index of output prices to deflate nominal GDP into a ‘real terms’ measure. Output prices are those received by domestic producers, and they exclude things like taxes, retail and wholesale imports and profit margins. However, the official measure of real earnings is deflated using an index of consumer prices. This includes all retail margins, taxes and import prices. As the chart below shows, consumer prices – whether measured by CPI or RPI – have trended well above output prices, and to a degree not seen prior to 2010.
Trending price inflation for CPI, RPI and output prices (GDP deflator)
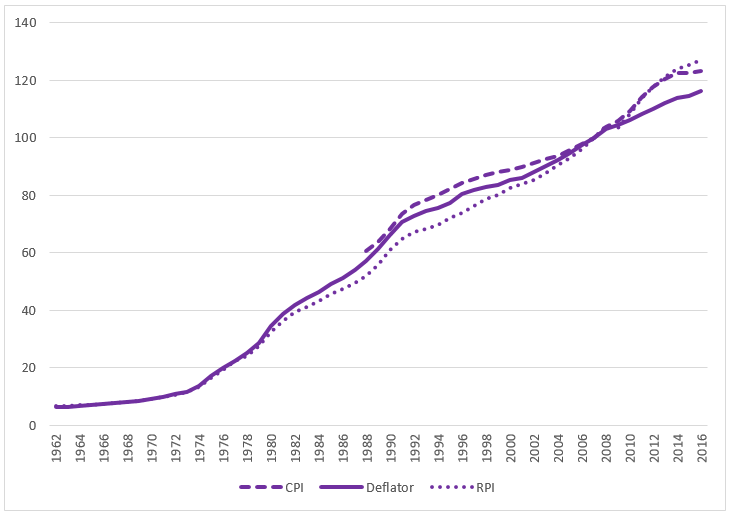
Source: Authors calculations based on ONS estimates for CPI, RPI and the GDP deflator
The result is that rising living costs, as seen every day on the high street and in consumer bills, have consistently exceeded the more narrow definition of inflation that is used to measure official GDP growth). And they have done so to an extent that is historically unprecedented.
Furthermore, a simple experiment demonstrates that it is this surge in consumer prices – relative to output – that has driven the decoupling in real GDP and real wages. The chart below is a reproduction of the first chart above. But this time it includes an unofficial measure of real GDP, estimated using consumer prices rather than output prices, and an unofficial measure of real wages, calculated using output inflation rather than consumer inflation.
When the same measure of price inflation – either output or consumer prices respectively – is used to deflate both GDP and wages, the two continue to trend together beyond 2010. In terms of output prices, real wages have stagnated rather than fallen, and real GDP measured by consumer prices continued to contract after 2010 and has yet to recover.
As Wren-Lewis concluded, it’s not so much that GDP and earnings have decoupled, but that real GDP, when ‘properly measured’, has been stagnant. Compared with the average lived experience in terms of pay, the official figures that claim general economic recovery are essentially a statistical mirage.
GDP per employee and average weekly earnings, each deflated by output prices and consumer prices
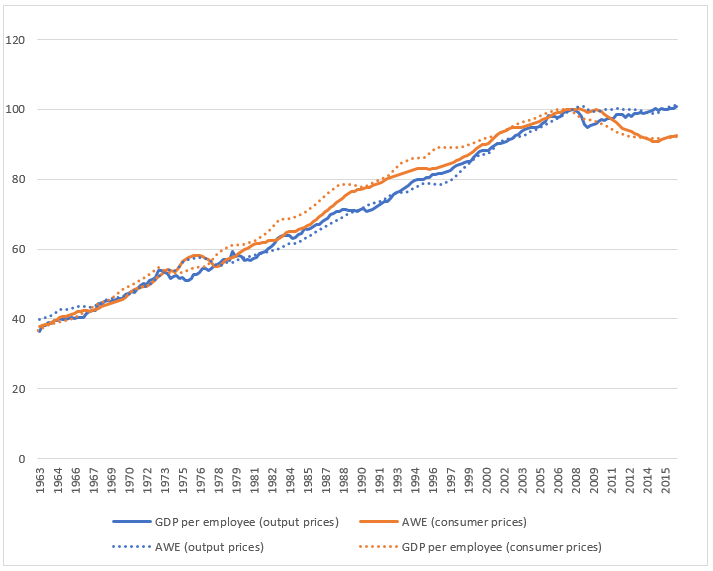
Source: Author’s calculations based on ONS estimates for real GDP, average weekly earnings (2000 onwards), employment (1971 onwards), retail price inflation (RPI) and output prices (GDP deflator); ONS experimental data for historically consistent average weekly earnings (prior to 2000); and Bank of England historical estimates for annual employment levels (prior to 1971). Note: We use RPI to deflate average weekly earnings as the CPI index from the ONS does not go back before 1989
But this is of much more than arithmetical interest: deeper economic reasons underpin this price- driven divergence in official GDP and earnings.
The decoupling between wages and growth coincides precisely with the UK’s trade (and current account) deficit. The UK’s debts to the rest of the world more than doubled in size between 2010 and 2016. This in turn followed the crash in the value of sterling in 2009. This would suggest that rising import prices, caused by a weaker pound, have driven a wedge between the prices of domestic output and the prices actually experienced by consumers. It is this which has caused the decline in real wages relative to GDP.
This coinciding of a depreciating currency value, a widening current account deficit and a fall in real wages points to an economy that is seriously unhealthy. With the business sector now a net saver in the economy and the government’s austerity policy keeping overall demand weak, growth has largely been driven by household consumption, much of it fuelled by unsustainable levels of debt. Equally worrying is that UK industry has not been able to take competitive advantage of the devaluation in the pound to raise exports, output and wages.
As the Archbishop said, this model is broken: and with another collapse in sterling coming last year following the vote to leave the EU, followed by a renewed contraction in real wages since the beginning of 2017 – let alone the effects still to come from Brexit itself – business as usual is not an option.
Time for Change, the interim report from the IPPR Commission on Economic Justice sets out the scale of our economic problems. In autumn 2018, the Commission will publish its alternative approach.
Related items

Reclaiming social mobility for the opportunity mission
Every prime minister since Thatcher has set their sights on social mobility. They have repeated some version of the refrain that your background should not hold you back and hard work should be rewarded by movement up the social and…
Facing the future: Progressives in a changing world

Realising the reform dividend: A toolkit to transform the NHS
Building an NHS fit for the future is a life-or-death challenge.