Article
Think tankers, for example at the Institute for Fiscal Studies, the Resolution Foundation and IPPR, often like to use ‘distributional analysis’ to assess the impacts of policy on households, and these analyses are often picked up on in wider debates over fairness.
To test whether a policy change is ‘progressive’ – where its impact on poorer households is more positive than it is on richer households – a preferred method is to group all households in the population into buckets, ordered from lowest income to highest, and show the average effect of a policy for each bucket.
The benefits of this type of analysis are obvious. The relatively complicated question of progressivity can, at least for a given metric, be reduced to a visually clear and accessible chart: answering the question of fairness seemingly irrefutably, at least in quantifiable terms.
An influential part of the IFS’s excellent election manifesto analysis was just such a chart, showing the distributional impact of all tax and benefit proposals from the Conservative, Labour and Liberal Democrat manifestos (reproduced below).
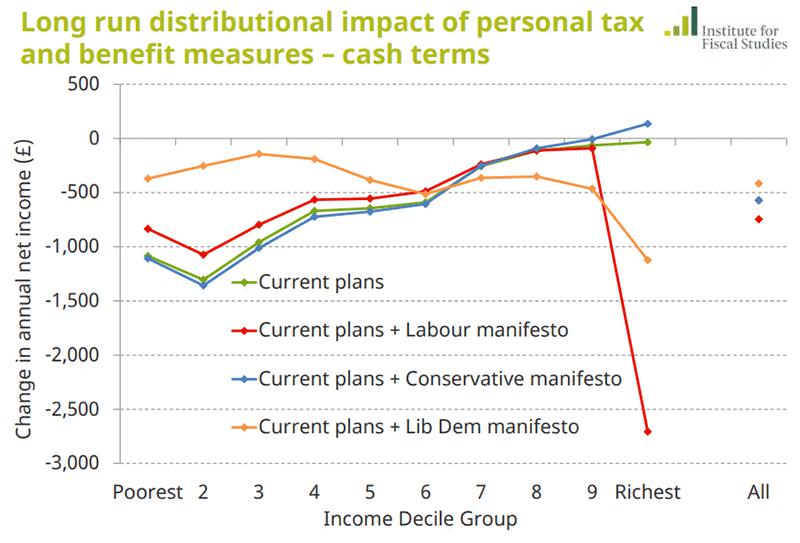
The analysis is striking on two accounts. First, it appears to show that the policies in Labour’s manifesto are almost perfectly regressive: from the second to the ninth decile, the poorer a family is, the worse off Labour’s plans would make them. Second, Labour’s plans appear pretty regressive even relative to the other two parties: almost as regressive as the Conservatives, and far more so than the Liberal Democrats.
This chart in particular has helped fuel a broad, alternative narrative that has emerged about the Labour manifesto since the election. This narrative suggests that, far from being radical, the impact of the policies recommended wasn’t even redistributive. For example, John Rentoul reproduced the same chart in his article for the Independent and Andrew Harrop leant on IFS analysis for his piece in the Guardian. Less formally, the arguments have attracted particular traction on social media with commentators such as Robert Peston at ITV and Jeremy Cliffe at the Economist reposting the chart on Twitter.
***
Is this correct? Would the effects of implementing Labour’s manifesto be not only to take away from the poor, but to take away far more than they would from the rich?
The answer is either an unequivocal ‘no’ or ‘we don’t know because the analysis hasn’t been done’, depending on the interpretation of ‘effect’. But the answer certainly is not ‘yes’.
Commentators have misinterpreted the IFS work in two important ways.
First, the IFS did not assess the whole of the Labour manifesto. They did not even reflect most of it.
Distributional analysis is most effective in assessing impacts that can be measured, reasonably unambiguously, in a monetised form. Quite sensibly then, and as is often standard practice, the IFS applied their analysis to tax and benefit reforms only – excluding services or other government programmes. Even tax measures where the ‘effective incidence’ (the final, often indirect impact of a tax on households, as opposed to the entity that might have paid the tax in the first instance such as a firm) is equivocal,[1] such as corporation tax, were excluded.
This means the analysis only assessed a fraction of the Labour manifesto’s tax rises[2] (around £8bn from £49bn) and spending commitments (around £4bn from £49bn).[3] In the case of Labour, unlike the manifesto itself which was supposedly cost neutral, the analysis included almost twice as many ‘takeaways’ (tax rises) as it did ‘giveaways’ (additional welfare support).[4]
The final picture, then, is not a reflection of the whole manifesto, but of less than 8 per cent of spending commitments and 16 per cent of tax rises. Some of the measures excluded would likely have had a broadly progressive impact, such as increasing the living wage to £10 per hour,[5] applying VAT to private school fees, scrapping planned giveaways in the taxation of inheritance and capital gains, restoring the Educational Maintenance Allowance and boosting Sure Start.
For those reforms that reflected a stronger principle of universalism – such as the National Education Service, increased child care and scrapping university tuition fees – the effects are less clear and possibly regressive in a strict accountancy sense.
But the IFS work cannot help us reach a conclusion either way because they are excluded from the analysis. Since the UK is one of only six countries among 35 OECD members where the state spends more on welfare in kind than it does in cash, it would be an especially poor outcome for our political discourse if benefits in kind were to be excluded from our redistributive conversation altogether.
The second reason is that the IFS did not at any stage assess manifesto commitments in isolation.
All distributional analysis is essentially an exercise in simulating a number of scenarios, one of which is treated as a ‘baseline’, and all the others as counterfactuals. The estimated impact of a specific counterfactual scenario is essentially just the total difference observed with the baseline scenario.
In addition to the issue of which, and how many, manifesto measures are included, the issue of what is in or out of the baseline relative to the counterfactuals is therefore also critical.
In the case of the recent IFS work, the baseline excluded the suite of policies that have already been legislated for and in some cases already begun to be implemented but nonetheless not come into full effect. The IFS make this clear by labelling each manifesto scenario in the chart as the sum of both ‘current plans’ and the personal tax and benefit announcements from a respective manifesto. Most notable among them is the introduction of the Coalition Government’s flagship welfare reform: Universal Credit (UC).
This choice is not without merit but it is also not beyond question:[6] for example the Office for Budget Responsibility’s standard baseline always includes all planned policy that is presently legislated for.[7]
For the purposes of assessing distributional impact, then, the IFS excluded the entire system of UC (which has been legislated for since 2013) from the baseline. This meant that each of the counterfactual scenarios (including the Labour one) included the full effects of UC as well.
This had an especially large impact on the analysis since the backlog of government reforms currently still being implemented dwarfs the comparatively smaller tax and benefit measures proposed in the manifestos. The Liberal Democrats are the closest to an exception where, unlike Labour and the Conservatives, a far greater proportion of their spending plans affected welfare spending in general, and spending on UC in particular.
Whether this is the right way to conduct analysis depends entirely on the question that is being asked.
If the question is: compared with the world as it is configured today, would the tax and benefit system be more regressive in five years’ time after taking account of all the Government’s current reforms that are in the process of implementation in addition to party manifesto pledges? The answer is the same for all parties because of the sheer scale of government reforms in the pipeline: ‘yes’. (Although the point remains that this would still only represent a small portion of total tax and spending announcements from Labour’s manifesto in particular, so the full picture is still unknown).
But if the question was: after taking into account the Government’s current reforms to today’s tax and benefit system would the additional impact of the personal tax and benefit reforms scored from Labour’s election manifesto, taken in isolation, be regressive? The answer is absolutely not.
If interpreted correctly, the IFS analysis actually gives the answer to both of these questions. Compared with the world as it currently is (essentially the x-axis itself) all the manifesto policies are broadly regressive, albeit to varying degrees. But compared with the world as currently planned (the IFS’s scenario labelled in green) both the Labour and Liberal Democrat lines are clearly more progressive.
What determined whether the absolute figures presented in the chart were largely negative rather than positive – and therefore perhaps the immediate impression that the analysis leaves with readers – was the choice of baseline. If the ‘current plans’ scenario were to have been the baseline (as is more consistent with the OBR’s standard baseline) the Labour and Liberal Democratic manifestos would have been presented as having a net positive and progressive impact on households in the bottom half of the distribution.
Had that chart been produced instead, any alternative narratives about the Labour manifesto would have been less likely to misinterpret the evidence – although the chart itself would have been no more right or wrong for it.
***
This discussion does not amount to a criticism of either distributional analysis of personal tax and benefits in general, nor of the IFS’s work in particular. The former is an essential tool – when applied appropriately – for assessing particular measures of fairness. The latter execute their work extremely well and in a way that often enhances the quality of the UK’s political conversation.
In particular, on both the main points raised above (the limited number of manifesto measures included and the choice of baselines), the IFS are entirely transparent. The title of their chart is labelled as analysis of ‘personal tax and benefit measures’ only, and the full list of policies included are published for all to see. They also make clear that their analysis has excluded ‘current plans’ from the baseline, and that current plans are included in each counterfactual scenario. The author was also extremely helpful and obliging in answering any queries.[8]
The very worst that can be said of the IFS in this instance is that they have not gone further out of their way to tackle what has grown into – at times – a dangerous misinterpretation of their analysis. But in a political climate where both wilful and accidental misinterpretation of economic evidence and theory is endemic – and often on far more serious issues than the technical progressivity of a single manifesto – their lack of intervention is unfortunate but understandable.
Neither do the points raised here absolve the Labour manifesto from an alternative or progressive critique: in particular, the absence of a more serious reversal of the Government’s welfare plans is highly conspicuous, not least given that the Liberal Democrats were able to go far further in their own commitments. And the critique of universalism from a principle of reciprocity, though not the final word, remains an area of useful discussion.
Probably the best conclusion that can be drawn from all this echoes that made by Torsten Bell of the Resolution Foundation in May. Commentators should be careful to not overstate the decisiveness of broad-brush analysis during an election campaign, where seemingly mere technicalities over methods and assumptions can actually shape entirely the final interpretation as much as the facts themselves.
Instead, more attention should be given to the broader direction of travel and the choices on offer.
At the last election, the real debate centred on the size and scale of the state, the balance of state support between welfare in cash or in kind, the divide between young and old, between the super-rich and the rest, and how principles of universalism, reciprocity and targeted redistribution should be brought to bear on questions of fairness.
These are the tests against which commentators should judge our political parties at the next election as well.
[1] Standard economic theory assumes that the final burden (effective incidence) of all taxes will eventually fall on households, through either wages, returns on capital or consumer prices. For some taxes – such as Corporation Tax – the relative importance of each of these transition mechanisms is uncertain, and therefore the end distributional effect cannot be known. For this reason, these taxes are often excluded from distributional analysis of type conducted by the IFS. It is worth noting that the IFS did not exclude the impacts of the Excessive Pay Levy on these grounds, assuming instead that the full economic incidence of this employer tax would transmit 100% to households through wages. Although this type of assumption is not without precedent – employer NICs is sometimes treated in a similar way – there are perhaps weaker grounds to include this measures in household distributional analysis than other labour tax and welfare changes.
[2] In fact, not all of the total revenue raised came from new or higher taxes. Labour claimed that £6.5bn would come from anti-tax avoidance, and around £2.6bn from expenditure savings.
[3] All these figures are sourced from Labour’s own manifesto costings, which, as with commitments from the other party manifestos, have not yet received independent verification.
[4] Another point worth noting is that distributional analysis is assessed prior to behavioural effects being considered. Interestingly, this means that Labour’s Income Tax reforms and plans for an Excessive Pay Levy both a have a disproportionately large impact on household incomes in the IFS distributional modelling relative to the IFS’s estimate of the corresponding revenue raised for the exchequer (which in the case of the Excessive Pay Levy was zero).
[5] Strictly speaking, raising the minimum wage is not a direct tax or spending commitment. The measure would clearly effect tax receipts through a combination of employment and wage effects, and effect expenditure through increased public sector wages, but Labour appear to have not attempted to estimate either
[6] It ensures that where the backlog of policy decision from both the current Government and the Coalition Government have yet to be felt, they are not forgotten from the debate about the future, but at the cost of possibly confusing (certainly in the mind of a cursory reader) what has been announced by a manifesto and what is unimplemented government policy.
[7] That is not to say that even the OBR’s baseline is beyond contention, for example see this blog by Emran Mian, former Director of SMF. The broader point is that baselines are hugely important for comparative analysis and yet, evidently, can vary hugely from one piece of work to the next.
[8] The author of this blog would like to thank Robert Joyce for answering a number of queries about the IFS’s chosen methodology
Related items

What makes a good Holyrood 2026 manifesto?
IPPR Scotland sets out five key tests
Turning energy support into investment leverage
The UK’s energy support risks missing growth by backing high-cost industries instead of those most likely to invest.
More for less? Employment, productivity and reform in Scottish public services
Excellent public services should be foundational to a flourishing society.