Press Story
The tax cuts announced in Reform's manifesto are both substantial and highly regressive, benefiting the wealthiest households the most. Our analysis of each tax change individually reveals the distribution of benefits across different income groups.
Breakdown of tax policies and their impact:
Increase in the tax-free allowance:
- Current allowance: £12,570
- Proposed allowance: £20,000
- Cost for 2024-25: £41bn
- Poorest 20 per cent of households: An increase of £380 in average annual household disposable income
- Richest 20 per cent of households: An increase of £2400 in average annual household disposable income
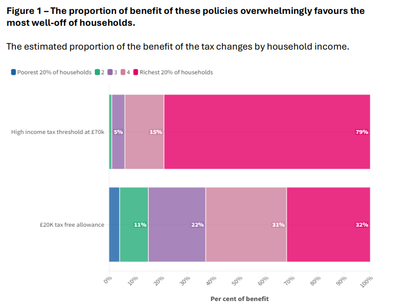
- Distribution of benefits: 32 per cent of the tax break goes to the richest 20 per cent of households
Increase in the higher income tax threshold:
- Current threshold: £50,270
- Proposed threshold: £70,000
- Cost for 2024-25: £18bn
- Poorest 20 per cent of households: An increase of just £17 in average annual household disposable income
- Richest 20 per cent of households: An increase of £2700 in average annual disposable income
- Distribution of benefits: 80 per cent of the tax break goes to the richest 20 per cent of households
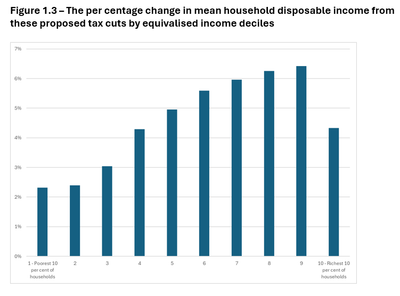
These tax breaks provide minimal benefits to lower-income households while significantly increasing the disposable income of higher-income households. Raising the tax-free allowance marginally benefits the poorest households but overwhelmingly favours the richest, who receive more than six times the increase. Raising the higher income tax threshold almost exclusively benefits the wealthiest households, leaving
the poorest unaffected.
Combined cost and impact
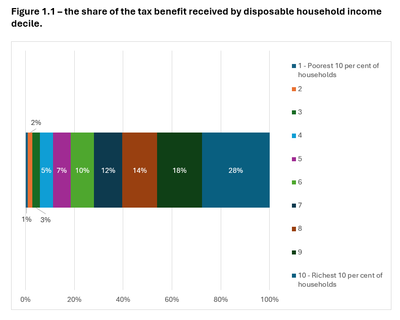
Together, the two key policies - increasing the tax-free allowance and increasing the higher income tax threshold - would cost £59bn. The benefit distribution is uneven across society, with the top 10 per cent of households receiving 28p for every £1 spent, while the bottom 10 per cent receive only 2p.
Impact on household disposable income:
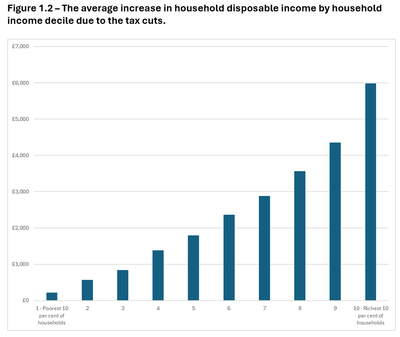
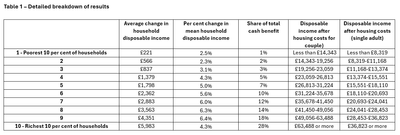
- The top 10 per cent of households are expected to gain an average of £5,980 per year in disposable income
- The bottom 10 per cent of households are expected to gain only £230 per year in disposable income
Income classification by decile:
- To be classified in the top decile, a single adult household needs £36,820 per year or more in disposable income, while a couple needs £68,490 or more
- To be classified in the bottom 10%, a single adult household needs to have £8,320 per year or less, and a couple would have £14,340 or less
- These figures all relate to income after housing costs, direct taxes and council tax