The cuts to come: What will Budget 2015 mean for departmental spending?
9 Jul 2015Press Story
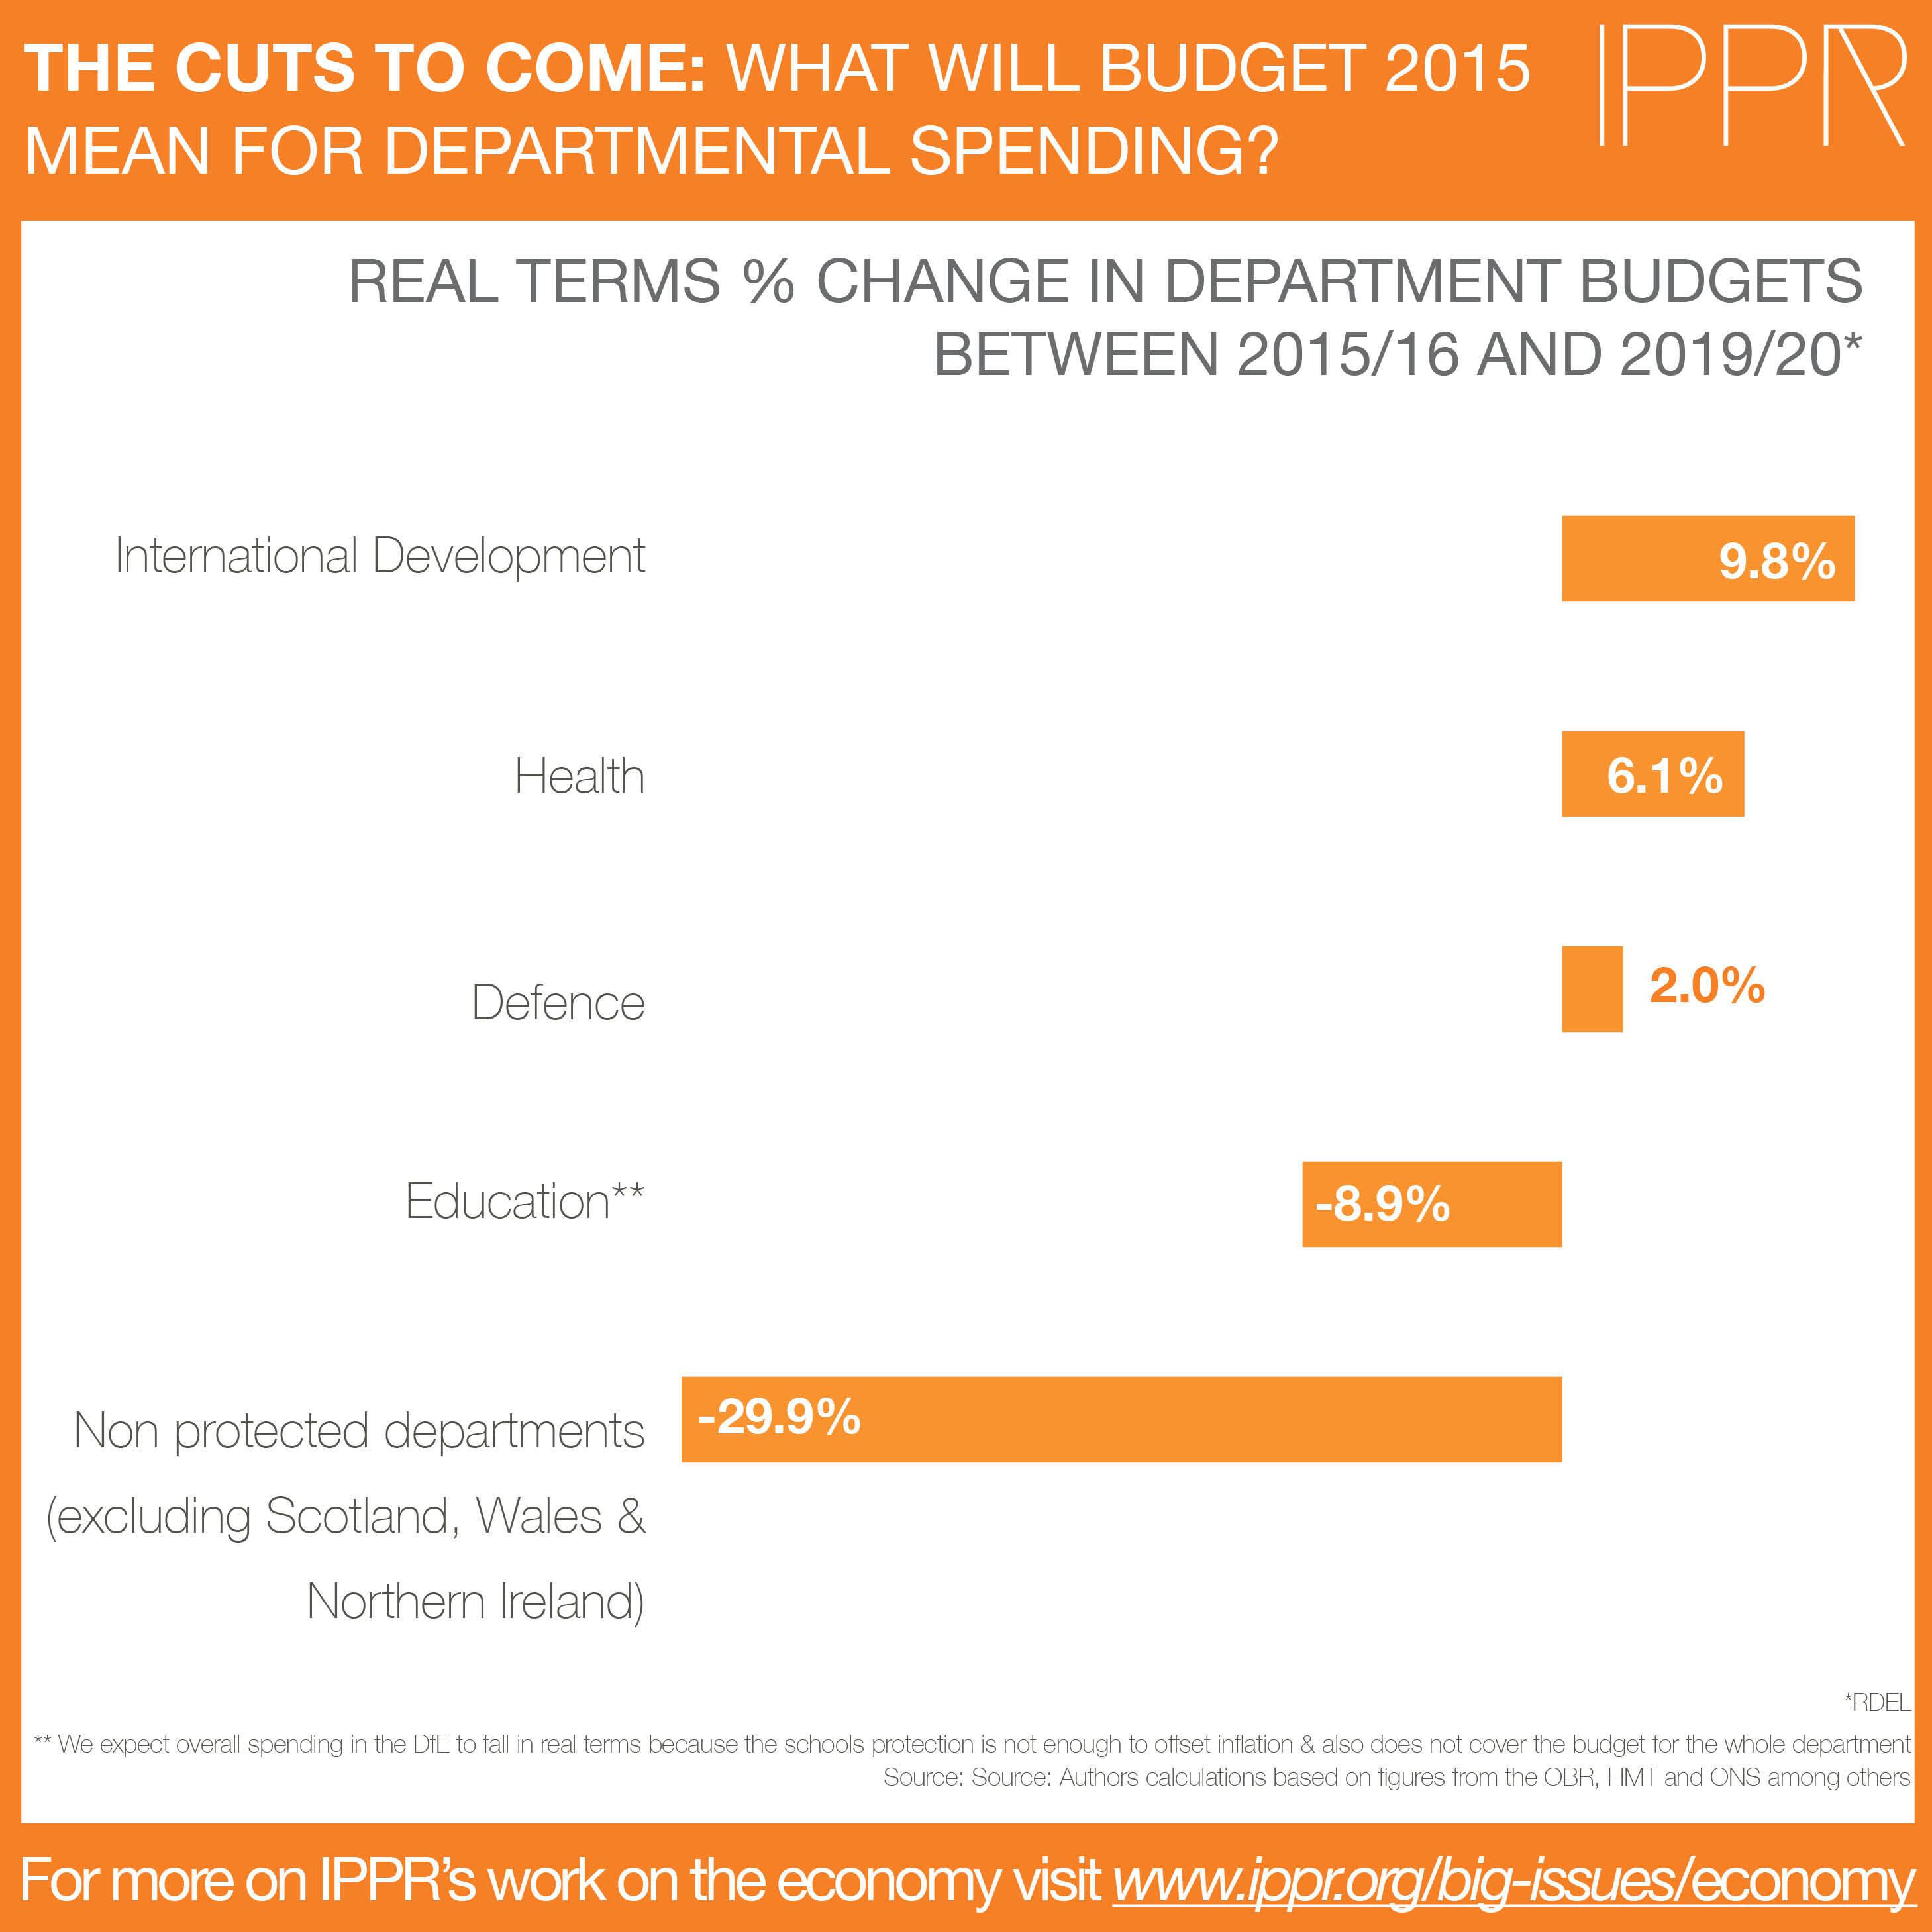
New IPPR analysis has shown that this could imply a real terms cut in resource spending for unprotected departments (excluding Scotland, Wales and Northern Ireland) of around 30 per cent by 2019/20, a cut of approximately 7.5 per cent on average in each of the next four years.
This compares to a total real terms fall of around 35 per cent for the same departments across the five years of the previous parliament (2011/12 to 2015/16), around 7 per cent a year on average.
This compares to a total real terms fall of around 35 per cent for the same departments across the five years of the previous parliament (2011/12 to 2015/16), around 7 per cent a year on average.
By way of an indication of what this may mean for individual departments over the coming years, our analysis suggest we could see around £5 billion taken out of the Department for Education, around £4 billion from Business Innovation and Skills and around £3 billion from Local Government by 2019/20.
![]()
Government spending can be described as either ‘capital spending’ used for investment, or else day to day ‘current spending’ on provisions and services. We know from the Office of Budgetary Responsibility (OBR) that the Chancellor intends to increase net capital spending across this parliament, so the bulk of cuts need to come from current spending.
Current spending again falls into one of two categories. The first category is ‘annually managed expenditure’ (AME). AME mostly covers outgoings that are contingent on social and economic changes, such as rises in out of work welfare payments caused by recessions. The second category of current spending is ‘resource departmental expenditure limits’ (RDEL). This represents money allocated to departments by the Treasury to run government services, such as schools and the NHS. By its very nature, RDEL is comparatively easier to plan and budget for. It is this area of government spending that is usually referred to when we talk about cuts to departmental current expenditure.
The burden of cuts set to fall on the first of these categories, AME, has been well documented in recent weeks. Today’s announcement confirmed the Government’s plans to find £12 billion in welfare savings, largely through reforms to in work tax credits and a freeze in working age welfare payments.
Less well documented, however, have been the implied headline cuts to individual departments and services. Total resource spending is expected to rise in cash terms from approximately £315 billion this year, to around £320 billion in 2019/20 (the year fiscal consolidation is set to end). However, this represents a fall of about 6 per cent in real terms over the period.


Our analysis has set out what this headline figure might mean for resource DEL budgets within individual departments. To arrive at our figures, we applied the government’s planned protections to health, schools, international development and defence, before subtracting these protected budgets from the OBR’s headline forecast for RDEL. The remaining pot of funding is then spread among non-protected departments in proportion to their size, and the Barnett formula used to give allocations for Scotland, Wales and Northern Ireland.
Of course, the Government has not yet told us (or do not themselves know) the details of how certain spending settlements will actually fall – including how the protected budgets in health, overseas aid and defence will be split between capital and resource. In the absence of this information we have made reasonable assumptions based on the evidence currently available, informed by relevant funding trends from the previous parliament.
Of course, the Government has not yet told us (or do not themselves know) the details of how certain spending settlements will actually fall – including how the protected budgets in health, overseas aid and defence will be split between capital and resource. In the absence of this information we have made reasonable assumptions based on the evidence currently available, informed by relevant funding trends from the previous parliament.